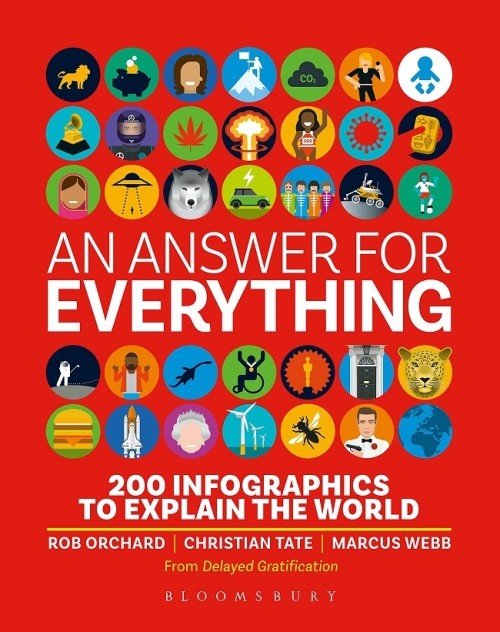
An Answer for Everything: 200 Infographics to Explain the World
This resource contains visuals and graphs that depict and explain a wide range of real-life scenarios in a concrete and entertaining way. The engaging, exciting visuals can help students to construct meaning about their world while they practice their critical thinking and analysis skills. Useful as a teacher’s resource to introduce a new topic, to demonstrate infographics and the application of mathematics to current events and pop culture, and as a general student resource book to assist with research projects. Note: student grade level and maturity should be considered when using certain infographics.